The following post was written by Maggy Stewart, Graphic Designer and Marketing Coordinator at RMS.
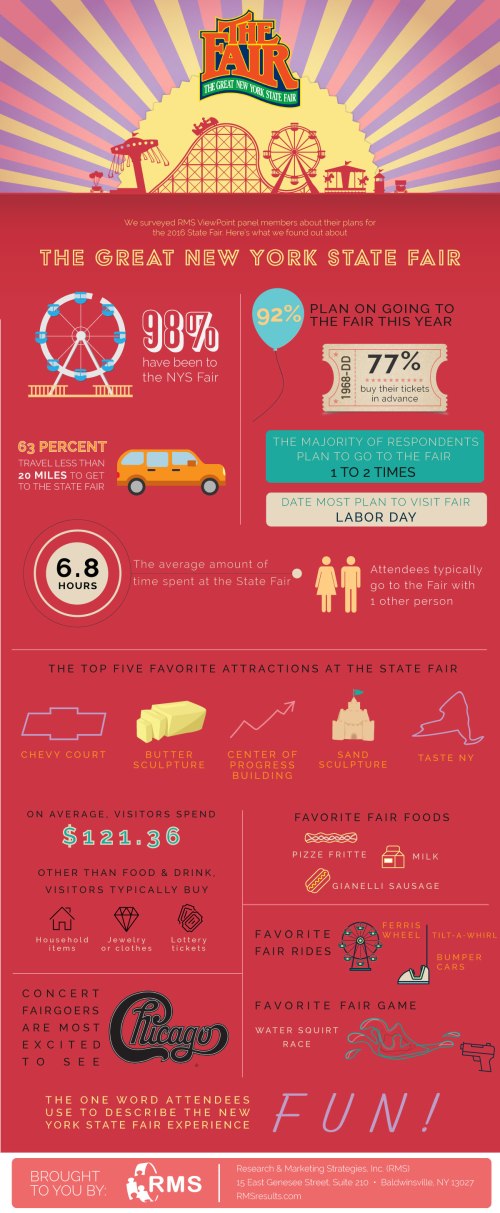
According to a recent poll of Central New Yorkers conducted by Research & Marketing Strategies, Inc. using the RMS ViewPoint panel, 62 percent of survey respondents plan to go to the State Fair one or two times this year. With 98 percent of Central New York respondents having been to the fair before, 77 percent typically purchase their tickets in advance. Although 40 percent are unsure of the dates they plan to attend the Fair, the most popular date visitors plan to attend is on Labor Day, also known as the Summer Send Off “Dollar Day.” More details, as well as the full infographic can be found below.
“In Central New York, the end of summer means the beginning of the Great New York State Fair,” said Zach Shaw, RMS ViewPoint Panel Associate. “The State Fair is a longstanding tradition throughout the entire region and is a great topic for a CNY survey.” Respondents surveyed were asked about favorite Fair attractions, preferred foods and Midway rides and games, spending habits, concert options and more. “Central New York continues to reign as a top test market in the country, and many brands and new products are exhibited at this highly anticipated and well-attended annual event,” said Sandy Baker, RMS Senior Director of Business Development & Corporate Strategy.
Drawing hundreds of thousands with a surplus of food, fun and entertainment, the New York State Fair attracts crowds locally and across the region. Sixty-three percent of respondents travel less than 20 miles to get to the State Fair, while 15 percent travel 21-30 miles, eight percent travel 31-40 miles, six percent travel 41-50 miles, seven percent travel 51-100 miles and two percent travel more than 100 miles. Respondents typically go to the Fair with one other person, and the average amount of time spent at the fair is 6.8 hours.
While spending a decent amount of daylight hours at the Fairgrounds, attendees have developed their own personal lists of “must see (and taste)” attractions and foods while visiting. When asked to pick all of their favorite Fair attractions, 75 percent of respondents yet again identified the Chevy Court as their favorite, followed by the butter sculpture (73 percent), Center of Progress Building (69 percent), sand sculpture (68 percent), Taste NY (57 percent), Horticulture Building (54 percent), beer/wine tent (45 percent), International Building (45 percent), art and craft exhibitions (38 percent), Midways rides and games (37 percent), Science and Industry Building (31 percent), and Iroquois Indian Village (29 percent). When it came to the Midway attractions, the Ferris Wheel came in as the favorite ride with 22 percent of respondents’ votes. Bumper Cars and Tilt-A-Whirl both followed with 17 percent. Also on the Midway, the water squirt race was voted the favorite game by survey respondents with 35 percent.
It’s no secret one of the biggest attractions at the State Fair is the enormous list of favorite fare and food vendors. When asked which Fair foods were favorites of respondents, pizze frite fried dough came in at number one with 49 percent, followed by milk (48 percent), Gianelli sausage (43 percent), potatoes (41 percent), BBQ (41 percent), ice cream (35 percent), Blooming Onion (34 percent), gyro (34 percent), funnel cake (29 percent), roasted ear of corn (27 percent), deep fried treats (25 percent), and fries (21 percent). Visitors spend an average of $121.36 while at the Fair, and aside from food and drink, respondents said they typically buy household items, jewelry/clothes and lottery tickets.
When asked which musical acts respondents were most excited to see this year, Chicago was top pick with 44 percent. Florida Georgia Line came in second with 29 percent, followed by Daughtry (28 percent), Keith Urban (27 percent), Air Supply (26 percent), ZZ Top and Gregg Allman (26 percent), The Commodores (21 percent), Culture Club (19 percent), Toto (17 percent), Flo Rida (15 percent), and Three Days Grace (13 percent).
When asked to describe the New York State Fair in one word, respondents’ top answers were “fun,” “awesome,” “tradition,” “interesting,” “great” and “exciting.”
The RMS ViewPoint poll was conducted from August 3, 2016 to August 10, 2016. A total of 1417 surveys were completed. Respondents consisted of RMS ViewPoint Research Panel members, as well as the general community. All respondents reside in New York State. For more information on RMS ViewPoint, visit RMSViewPoint.com.
Research & Marketing Strategies (RMS) is a full service marketing and market research firm located in Baldwinsville, NY. RMS provides an array of research methodologies that result in actionable analytics and recommendations for the client to enhance decision making. RMS is also home to QualiSight, a premier focus group and interview research facility, and RMS ViewPoint, a leading consumer research panel in Central New York. Visit our website at RMSresults.com.