Feeds:
Posts
Comments

Posts Tagged ‘Scales’

Scale Week is over, and much like the viewing audience at the conclusion of a very special episode of “Full House,” we are left to reflect on what we have learned, how we have grown from the experience, and what it all means. At the very least, it gives us a chance to end the week with this summary of six simple rules for using scales in survey research:

1. Keep it simple – There are many scaling techniques available to the survey researcher. Some, such as the Likert Scale are pretty straightforward, while others, such as the MaxDiff technique or Constant Sum Scaling are a bit more complicated. They all have their uses, but the researcher always needs to be mindful of keeping the survey instrument as simple as possible for the sake of the respondent. The researcher needs to use a technique that the client and those who will be reading the report will be able to understand. Some types of scaling techniques may require a great deal of prior explanation before they are administered and/or as they are being reported.

2. Stay consistent – This was already touched upon in previous posts, but it bears repeating. It is best to keep the rating system and format used in a survey consistent throughout. Don’t switch from a five-point scale to a four-point scale and then up to seven. Also, keep the positions of the value axes the same – if you start out with “least/worst/disagree/negative” type values on the left of the scale and “most/best/agree/positive” on the right, stick with that throughout the instrument.

3. Break it up – Excessive use of rating scales can be a major cause of survey respondent fatigue. This is especially true in self-administered surveys where there are long, uninterrupted lists of rating items on a page/screen or in a telephone survey where the caller must read item after item. The survey will seem much more manageable to the respondent if you break up the rating items into small chunks of perhaps three to six items at a time. If the series can be separated by other types of questions, such as simple yes/no, multiple choice, or open ends, that is ideal. At the very least, the clusters should be broken up into distinct subject headings, which brings us to…

4. Cluster related items together in a series, separate unrelated items – This piece of advice might seem like it goes without saying, but we sometimes see surveys that ignore this principle, so we will state it. Ideally, items should be placed into groups with related items. For example, if one were doing an employee satisfaction survey, some topic areas might be “Management,”  “Teamwork and Cooperation,” and “Physical Working Environment.” This type of grouping will add structure and cohesion to the instrument and reduces the extent to which the respondent has to jarringly switch mental gears from topic to topic after each question.

5. Don’t ask respondents to rate more than one item at a time – This, often called a “double-barreled question,” is a common mistake among novice survey writers. Each item in a rating scale should only consist of a single concept or attribute. Consider this Likert scale item:

Courtesy might be a part of professionalism, but they aren’t the same thing. How should the respondent rate a salesperson who was extremely polite, but dressed inappropriately and gave them a tattered business card with a no-longer-functioning phone number printed on it? In this case, courtesy and professionalism should each be their own distinct item in the series. Always use one concept at a time, and always keep in mind that even if you think two words mean exactly the same thing, the respondent might not think that way.

6. Take advantage of new scaling tools…when appropriate – There are many ways to express the values on a scale rather than just words or numbers. Graphical slider scales can be a simple and intuitive way to represent the points on a scale. Consider the five- and three-point scales below that clearly convey a meaning without needing any words or numbers:

These kinds of graphic scales can be appropriate in instances where one is surveying a younger audience, or where respondents might not have a full command of the language in which the survey is written. On the other hand, they might be a little too light-hearted or cartoon-ish for a survey about, say, banking. Along with graphic representations, online surveys present different options for the scale tool itself such as an analog-looking slider, rather than traditional check boxes. The key with these new options is to always consider the audience for which the survey is intended (not to mention the general level of traditionalism of the research client!) when deciding what is appropriate.

We here in the Bunker hope you have learned everything you ever wanted to know about scales in our First Annual Scale Week. With the knowledge you now possess, feel free to express your opinion on this or any other article in the series below on…you guessed it…the starred rating scale.

  • Click Here to view the Day 1 post on Constant Sum Scaling.
  • Click Here to view the Day 2 post on Semantic Differential Scaling.
  • Click Here to view the Day 3 post on Likert Scales.
  • Click Here to view the Day 4 post on Scaling Mistakes | What Not to Do.

Read Full Post »

It’s Day 4 of scale week here at the Bunker.  Today, we put together some scaling errors and ways in which scales should not be used.  These problems can lead to biased results, unintentional participant error and/or improper analysis.  Here are a few things that should be avoided if you, as a market researcher, are looking for accurate and representative results.

1) Biased/Weighted Scales

Market Research Scale Error

As you can see in the above scale, the level of agreement is covering more than half the scale making it weighted towards agreement.  Not only does offering more options for agreement than disagreement make the scale biased, but it creates the potential for unintentional respondent error.  People typically tend to view scales as having 2 extremes, with the middle being neutral.  The analysis that is performed could also be misrepresentative as a result.  If every respondent selected the middle of the scale, one might state 100% of the respondents are in agreement with the new ice cream being delicious.

2) Reversing Scale Order within a Survey

5 point scale order

Reversing scale order within a survey typically won’t be as blatantly obvious as the example above, but it does happen.  As seen in the example, it’s likely that the respondent agreed with both statements but misread the scales or assumed the scales were identical.  Reversing scale order within a survey can create confusion among the respondents; one might compare it to a cereal box game in which you attempt to spot the difference between two pictures.  Some might argue that reversing scale orders can be used in an attempt to combat straight-lining of answers, but also, it can create unintentional respondent error among those who are trying to legitimately answer questions.   There are various techniques that should be used to prevent straight-lining, but this is not one of them.  Click here to read our post that goes into further detail about data quality/integrity.

3) Using Different Point Scales (5 pt, 7 pt, 10 pt)

This scaling issue may not have as much of an effect as others, but it is important to keep all scales identical within a survey.  Respondents put themselves in a state of mind where they are evaluating in terms of a certain point on a scale.  By jumping between different 5, 7, and 10 point scales, it makes it difficult for the respondent to rate statements or questions using consistent judgment.  The other problem with using different scales within a survey is that they are difficult to compare when it comes time for analysis.

In order gather quality data, it is important to use market research scales properly.  Throughout the survey it is important that all the scaling questions be uniform to reduce bias and other problematic errors.  Also, like other questions in market research, they should be mutually exclusive and collectively exhaustive by not doubling up/overlapping categories and by covering all answers.  Avoiding these problems will only benefit your analysis in the end.

  • Click Here to view the Day 1 post on Constant Sum Scaling.
  • Click Here to view the Day 2 post on Semantic Differential Scaling.
  • Click Here to view the Day 3 post on Likert Scales.
  • Click Here to view the Day 5 post on 6 Tips for Using Rating Scales.

Read Full Post »

It’s Day Three of Scale Week and if survey rating scales were ice cream flavors, the Likert scale would be pure vanilla. It’s commonplace and unglamorous. Some might even call it old-fashioned. But it works and is useful in a wide variety of situations.

Scale #3 – Wednesday

In fact, the Likert scale is so widely used that some people use the name Likert interchangeably with any type of rating scale. A true Likert or “Likert-type” scale presents the respondent with a series of statements and asks them to indicate their level of agreement with those statements by using a scale with an odd number of points. Five-point scales are the most popular variety, but seven-point scales are also commonly used. A typical Likert scale looks like this:

It is also common to use numbers along with, or in place of the code labels like this:

Another technique that works well when using a larger scale or when administering the survey over the phone, is to present the scale numerically with only the extremes and the midpoint labeled.

There is some debate among researchers as to whether or not the points of a scale should be labeled. My own personal opinion is that the vast majority of people intuitively understand a numbered rating system. If you ask them to rate their agreement on a scale from one to five and establish that five means “strong agreement,” they’ll get it. After that, the point labels simply become window dressing. And, in some cases, they can actually confuse the issue, as they raise the question about the fine distinctions between adjectives describing degree. Consider this nine-point scale for example:

Is “mildly” really less than “moderately?” And even if it is, is the semantic difference between “moderately agree” and “mildly agree” roughly equal to the difference between “moderately agree” and “agree?” I honestly don’t know. And frankly it’s not something I want to think too hard about. I certainly don’t want a respondent wondering about it, to the point of distraction, when they are in the middle of a survey. That’s why I believe the example below is much cleaner, more intuitive, and more user-friendly.

The advantages of the Likert scale are many. It’s a quick and easy way to measure the degree to which respondents feel a certain way. Because it is so commonly used, it doesn’t normally require a great deal of explanation to complete or create confusion on the part of the respondent. From the standpoint of analysis, the findings are easy to numerically tabulate, graph, and report in such a way that even the most number-averse client can understand at a glance.

But it’s always possible to have too much of a good thing. Too many Likert scales in a survey instrument can lead to respondent fatigue and “straight-lining” (the practice of giving all attributes the same rating down the line without thinking about it in order to complete the survey faster). It is often argued that a person’s response to earlier rating questions can sometimes bias their responses later on in the survey. Another pitfall, which is often seen in DIY research administered with Survey Monkey and similar applications, is the tendency of novice survey writers to slip simple yes or no questions into a series of rating questions, as with the third item in the example below:

So there you have it, the humble yet versatile Likert scale. It might not be the sexiest rating scale we write about during Scale Week, but it’s a true workhorse. It should be an item in every survey writer’s toolbox. As long as you don’t overdo it or use it for the wrong kind of question, the Likert scale will serve you well.

  • Click Here to view the Day 1 post on Constant Sum Scaling.
  • Click Here to view the Day 2 post on Semantic Differential Scaling.
  • Click Here to view the Day 4 post on Scaling Mistakes | What Not to Do.
  • Click Here to view the Day 5 post on 6 Tips for Using Rating Scales.

Read Full Post »

It’s Day 2 of Scale Week here in the Bunker and the excitement and anticipation is growing.  Here you might learn about or refresh your knowledge on another scaling option for your survey.  Like we said yesterday on Twitter, it’s like a market research Shark Week, without sharks.  Check out Monday’s post on Constant Sum Scaling by clicking here.

Scale #2 – Tuesday

Semantic Differential Scaling (SDS) most commonly uses adjectives to describe opposite extremes of a concept.  It is set up in a survey by using a contrast of two adjectives related to your concept you are testing (warm-cold, good-bad, easy-difficult).  This is administered through a bipolar scale as seen below; let’s carry over Monday’s example involving the auto industry.  In this question, we have asked the respondent to rate their attitude towards a new vehicle launched in the market this past year.  All of the adjectives relate to how the respondent feels towards this new vehicle model.  This is one of the most common uses for the SDS scale – new product concept testing.

Each value is assigned a rating of -3 through +3 with 0 being neutral.  Although the level of measurement between each value is unknown, creating an ordinal scale here helps the respondent interpret and weigh their attitude.  Typical adjectives used in this type of scale test are evaluation, potency, and activity (EPA) – such as good-bad for evaluation, strong-weak for potency, and fast-slow for activity.

A few limitations with this scale involve issues with mutual exclusivity and collective exhaustiveness.  Finding the right pair of adjectives to appropriately judge the product or service is key.  For example if respondents established a negative view of your product through poor customer service when dialing the help line, those negative attitudes may not be uncovered through adjective testing specifically related to the product itself.  Also if you are focusing too much on one single EPA above, you may have significant overlap between adjective pairs.  Is there a significant difference between someone rating their attitude on new-old versus unique-standard?  It’s arguable.  RMS recommends using no more than 10-12 all-encompassing pairs.  Try and choose words that are clear-cut and unambiguous.  A strong set of adjectives to test can be created through initial qualitative research – perhaps using a focus group.

SDSs are an integral part of concept testing for the marketing of products and services.  Using adjective extremes helps the respondent communicate their attitudes to assist your research in measuring image and brand equity.  We’ve also seen SDS broaden its horizons more recently by working its way into more common customer satisfaction surveys and employee surveys.

  • Click Here to view the Day 1 post on Constant Sum Scaling.
  • Click Here to view the Day 3 post on Likert Scales.
  • Click Here to view the Day 4 post on Scaling Mistakes | What Not to Do.
  • Click Here to view the Day 5 post on 6 Tips for Using Rating Scales.

Read Full Post »

We all know of Discovery Channel’s Shark Week, so the Bunker decided to cater to the Market Research arena and create our 1st Annual “Scale Week.”  Each day this week, the Bunker will profile a different scaling technique used in market research modalities.  We hope these articles will be useful to anyone looking for a brief overview of a specific scale, or someone who is just looking to explore the various options for their own market research.  If you stumble upon this article in hopes of finding Shark Week excitement, and find yourself extremely disappointed, we sincerely apologize.  But nonetheless, we encourage you to read on.

Scale #1 – Monday

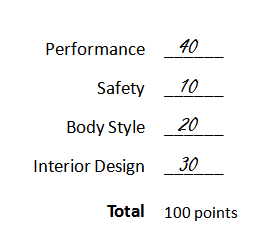
Constant Sum Scaling is a scaling method used to organize and sort a variety of options.  The respondent is presented with a few options and given a number of points to allocate to each option.  Aside from being used in surveys and questionnaires, constant sum scaling can also be used in more qualitative settings such as focus groups or in-depth interviews, as a way to spark discussion.  Here is a basic example of a constant sum scaling question that might be included in a survey (see below).  This particular question tries to uncover buying behavior behind purchasing a vehicle.  The respondent is asked to allocate 100 points among 4 key features of purchasing a vehicle based on their importance of each.

constant sum scaling, market research

By entering the relative value of each feature into the equation, constant sum scaling can be used as a way to understand comparative importance when respondents are presented with multiple options.  By adding more points to one feature, the respondent is in a sense taking away from points that could be allocated to other features – as the constant sum is 100 points.  Doing this through an online survey and using some additional logic to ensure a sum of 100, creates nice and clean data to analyze.

By placing the respondent in this budgeting mindset, they are forced to make an allocation.  The respondent is not allowed to rate every option to the max, as it forces them to base their response proportionally.  If a traditional 1-10 scale is used here, the respondent may rate all 4 aspects as a 10 (very important), not giving the analyst the option to determine relativity.  However, in this case above, the analyst can come to the conclusion that the respondent views performance of a vehicle as four times more important than safety.

One might argue that the equivalent to straight-lining 10s would be breaking the total points into equal categories (for example: 25/25/25/25 into each aspect above).  Sure, they may ultimately choose this even split if they choose, but the constant sum scaling option encourages the respondent to think comparatively before answering, something that should not be taken for granted with the ever-growing need for data integrity in market research.

  • Click Here to view the Day 2 post on Semantic Differential Scaling.
  • Click Here to view the Day 3 post on Likert Scales.
  • Click Here to view the Day 4 post on Scaling Mistakes | What Not to Do.
  • Click Here to view the Day 5 post on 6 Tips for Using Rating Scales.

Read Full Post »